What it measures
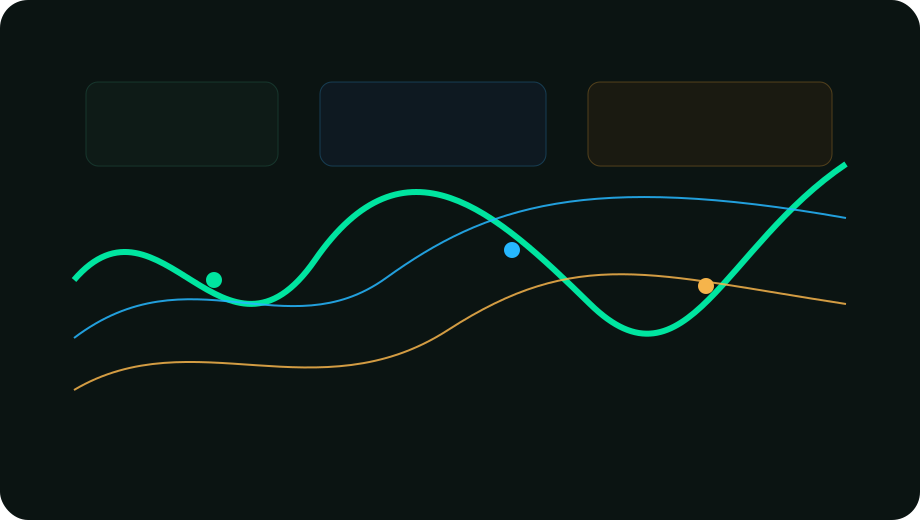
This guide treats Bollinger Bands as a measurement tool. It can clarify volatility expansion, contraction and relative extremes, but it should be compared with price location, volatility and the current market regime.
How to use it
Start with a clean chart, define the market condition, then use the indicator to confirm or challenge the reading. Good use means fewer decisions, not more noise.
Works best with
Pair it with market structure, support/resistance, session awareness and a written risk plan.
Limitations
No indicator removes uncertainty. Late signals, conflicting regimes and low-liquidity sessions can reduce usefulness.
Educational content only. Nothing on this site is financial advice, a trade signal or a promise of profit. Always manage risk and test ideas before using them live.